


Edge Services Observability - Part 2

In Part-1 of this Blog Series, we introduced Project ESO - Edge Services Observability (released as VMware Fling). P.K and I would like to thank all those had the opportunity to use ESO and provide feedback to us. We certainly appreciate all the fedback! We also had the opportunity at VMworld 2021 to demonstrate several use-cases made possible with ESO. The session is available in VMworld 2021 On-demand Video Library if you would like to check it out.
In Part-1 of this Blog Series, we covered the features, deployment and configuration of ESO, along with some tips and tricks. In this blog, we are excited to discuss popular use-cases and integration options for automated alerts and event-driven remediation.
Architecture and Technology Stack
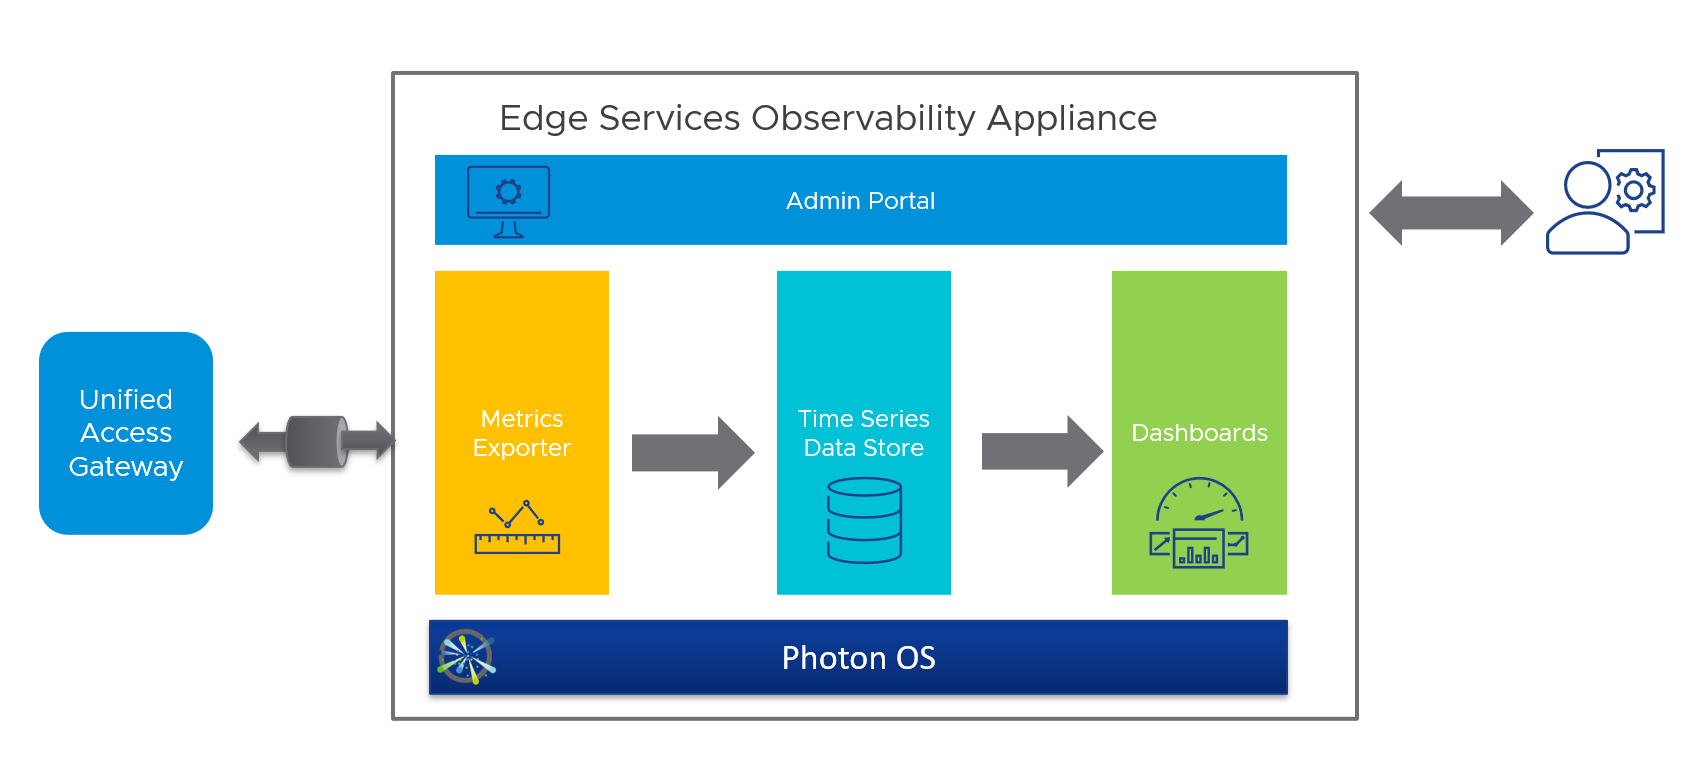
Before we discuss the use-cases, let us quickly cover ESO’s technology stack and architecture. Both, P.K and I are strong proponents of opensource software. So, we started with Photon OS as the building block for the virtual appliance. As you are aware, Photon OS is an open source linux distribution maintained by Vmware that has been part of many popular VMware products, including and especially the Unified Access Gateway. We also wanted the deplpoyment of the ESO virtual appliance to be simple and as close as possible to the UAG deployment.
Once deployed, you have access to a Web based Admin Portal for managing the configuration. You authenticate into the Admin portal using credentials supplied during the appliance deployment. You can now use the portal to configure the list of UAGs that need to be monitored. Once you add a UAG to the portal, there is a status field in the UI that indicates whether ESO has started polling the UAG or if there was any error encountered. There are some tips with the portal to troubleshoot any errors encountered during the process. Detailed steps can be found in Part-1 of this Blog series.
One of the most important components at the heart of the solution is the Metrics Exporter that polls the UAG’s monitoring APIs for metrics, parses the response and stores the metrics data in a Time Series Datastore powered by Prometheus. In the current configuration, the Metrics Exporter polls UAGs every minute, and the data store has a data retention period of 30 days.
Finally, you have access to dashboards powered by Grafana to visualize the metrics data collected. We have made some sample dashboards available for VMware Tunnel and Horizon to help administrators get started. There is also a bonus dashboard to monitor the performance of ESO appliance itself, so you don’t have to rely on another tool to monitor this solution. The Dashboards not only let you visualize the metrics but also configure alerts based on defined triggers.
Use-cases Beyond
There are several benefits to leveraging ESO for monitoring UAG (Unified Access Gateway) metrics. The telemetry data from ESO gives administrators visibility into UAG Edge Services Performance, with several metrics carrying significant security value and insights. ESO also helps with benchmarking your average traffic vs peak traffic to keep your UAG sizing meet your changing traffic requirements. Most importantly, ESO provides a consolidated view of metrics across Horizon and UEM Edge Services from the UAG for the End User Computing team.
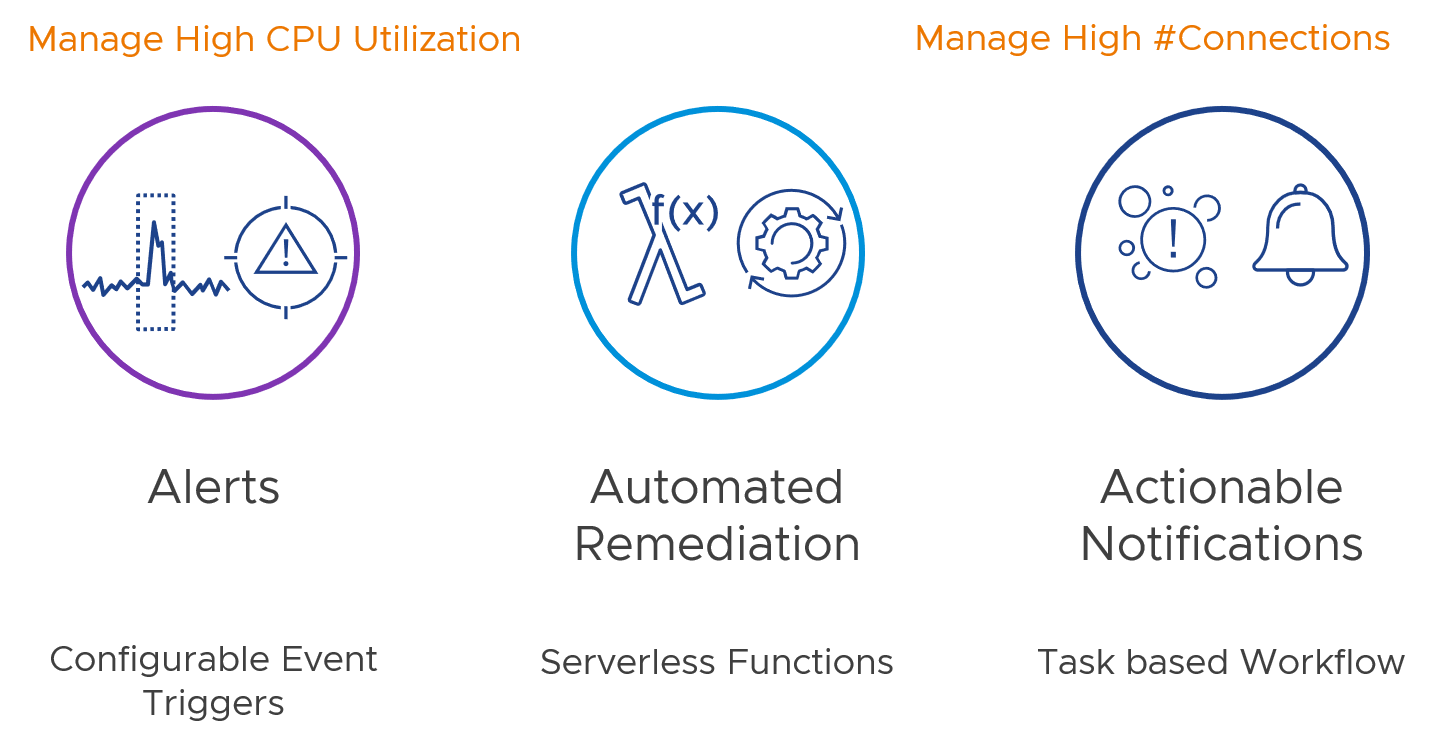
As highlighted earlier, ESO empowers administrators not only to visualize metrics data but also configure alerts based on defined triggers. Once you benchmark your average/ healthy / normal traffic, you can configure event triggers that qualify as anomalies.
Grafana supports various notification channels like Email, Slack, Pagerduty, Opsgenie as well as Webhooks
Leveraging webhooks as a notification medium, opens up a world of possibilities by allowing us to call serverless functions to handle automated remediation actions. We will explore one such option in this blog, where we will demonstrate integrating with [VMware Event Broker Appliance] (https://vmweventbroker.io/ “VEBA”) for event-driven automation
Another interesting use-case is to leverage Hub Services to create actionable notifications thereby building a task based workflow.
Use-case #1 - Manage High CPU Utilization
sample text
Use-case #2 - Manage High Connections
sample text