


Edge Services Observability for Unified Access Gateway

Unified Access Gateway (UAG) is a key component in most VMware End User Computing deployments, including Workspace ONE and Horizon. The UAG hosts various Edge Services like VMware Tunnel, Content Gateway, Secure Email Gateway, Reverse Proxy and Horizon Secure (External) Access. Additionally, the UAG can also provide DMZ Authentication and Identity Bridging. These services play a pivotal role in providing Zero Trust Network Access to corporate resources.
Now that we have established the significance of the UAGs, it is imperative that any organization would require metrics from monitoring the UAGs. While there are options to monitor the UAG from an appliance/infrastructure perspective, customers also require metrics at the Edge Service level (Eg: Authenticated VPN Tunnel Sessions etc.) to gain visibility into the connections being authorized into the company network to access resources. Currently, there is no centralized view of metrics consolidated from all UAGs across all Edge Services, nor is there a way to visualize trends over a period. Project ESO – Edge Services Observability (released as VMware Fling), is a monitoring solution that polls Edge Services metrics from all UAGs and renders the data as dashboards for visualization. Additionally, administrators have the ability to configure alerts based on conditions to get notified and detect anomalies.
Features
ESO is delivered as a ready-to-deploy virtual appliance, containing the following:
- Web based Admin Portal for configuring the list of the UAGs that need to be monitored
- Dashboards for visualizing metrics from all configured Edge Services in the UAG
Bonus: Sample Dashboards included for VMware Tunnel, VMware Horizon and ESO Appliance metrics
- Ability to setup alerts based on configurable triggers
Download
Download the OVA file from VMware Flings Site
Deployment
- Use vCenter to “Deploy OVF Template”
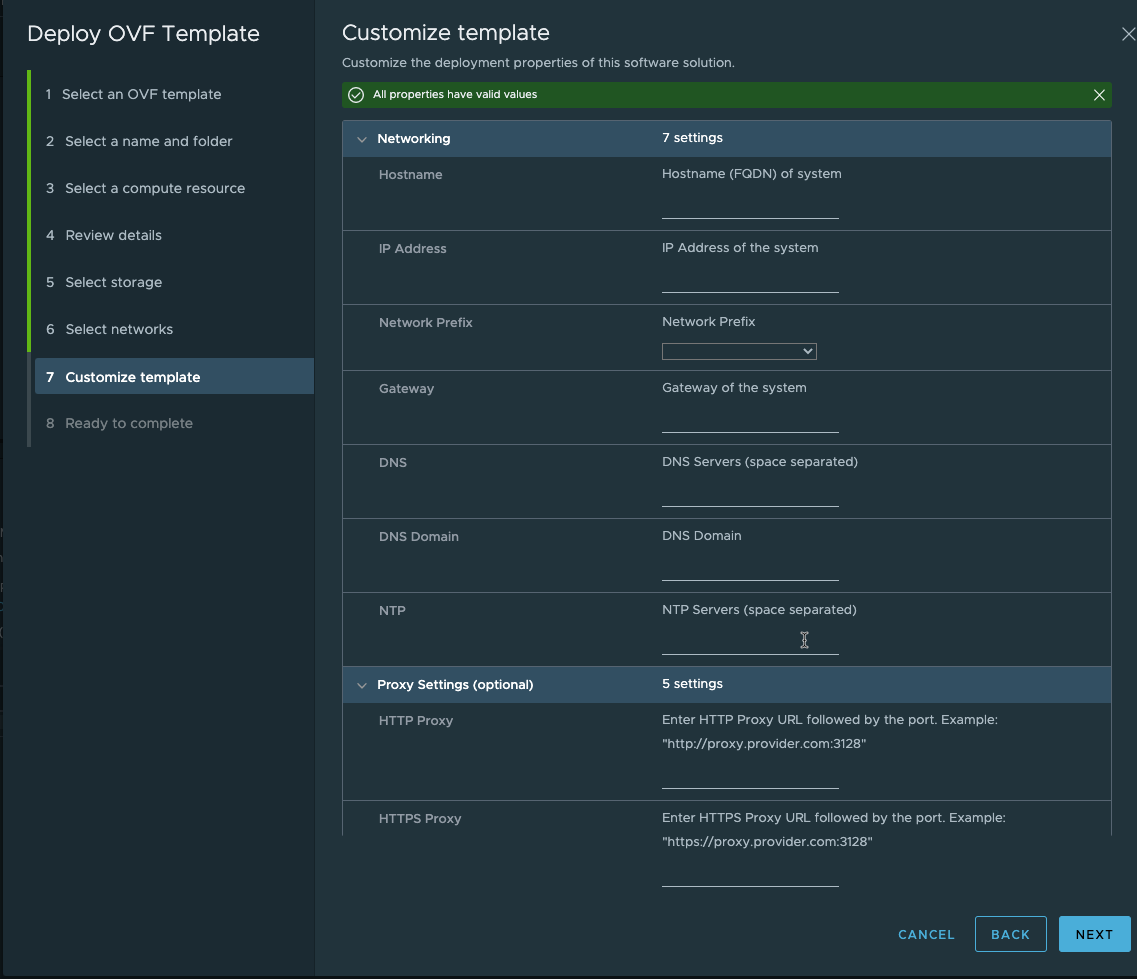
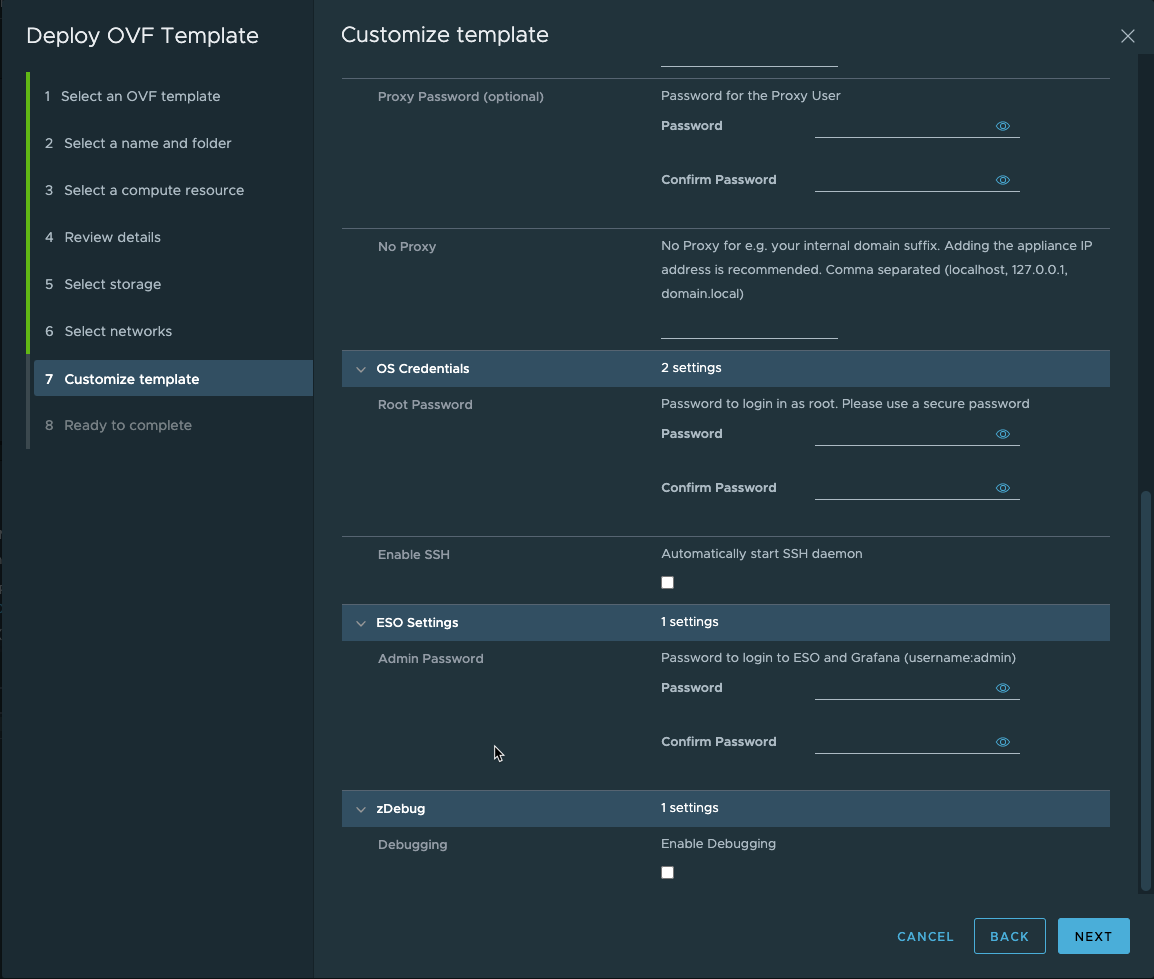
- Customize the following properties as required:
- Network Properties
- Password for logging into the Appliance Operating System (SSH/ vCenter Console)
- Password for accessing Admin Portal and Dashboards Page
- SSH Access
- Debug Logging for appliance deployment

ESO - OVA Deployment - Customize template
ESO - OVA Deployment - Customize template
Configuration
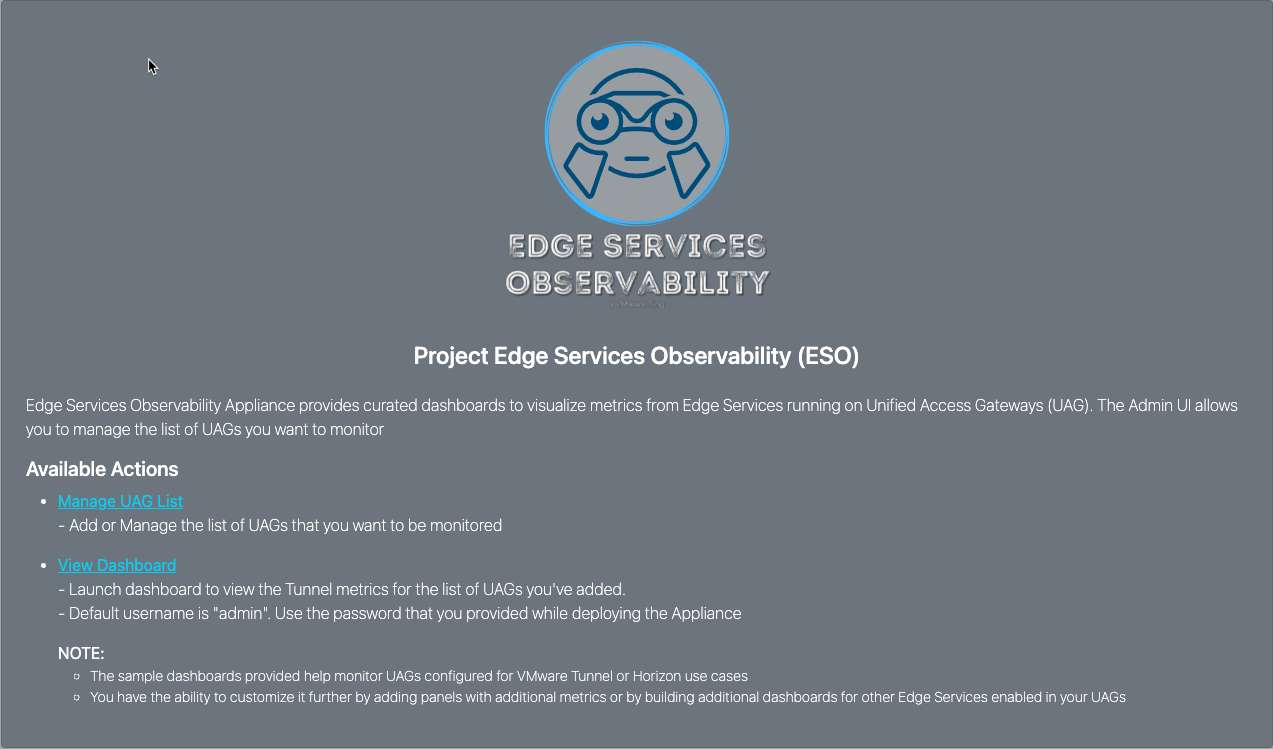
- Once the appliance is deployed and powered on, launch a web browser to access Admin Portal by navigating to the FQDN (over HTTPS) of the appliance
ESO Admin Portal Login

Note: Using IP Address (in lieu of FQDN) to access the Admin Portal on a web browser will result in an error due to certificate validation failure when attempting to login. This is because the certificates are generated for Hostname.Domain combination provided during appliance deployment. Please use FQDN to access Admin Portal on web browser. Hosts file entry should work if unable to register in DNS
- Log in with the password configured during the deployment of the appliance (Username is “admin”)
- The “Home Page” provides an overview and links to configure UAG list and access Dashboards
ESO Admin Portal Home Page - Navigate to the “UAGs” tab or select “Manage UAGs” link to configure the list of UAGs to be monitored
- Add the UAGs that need to be monitored using the “Add UAG” button
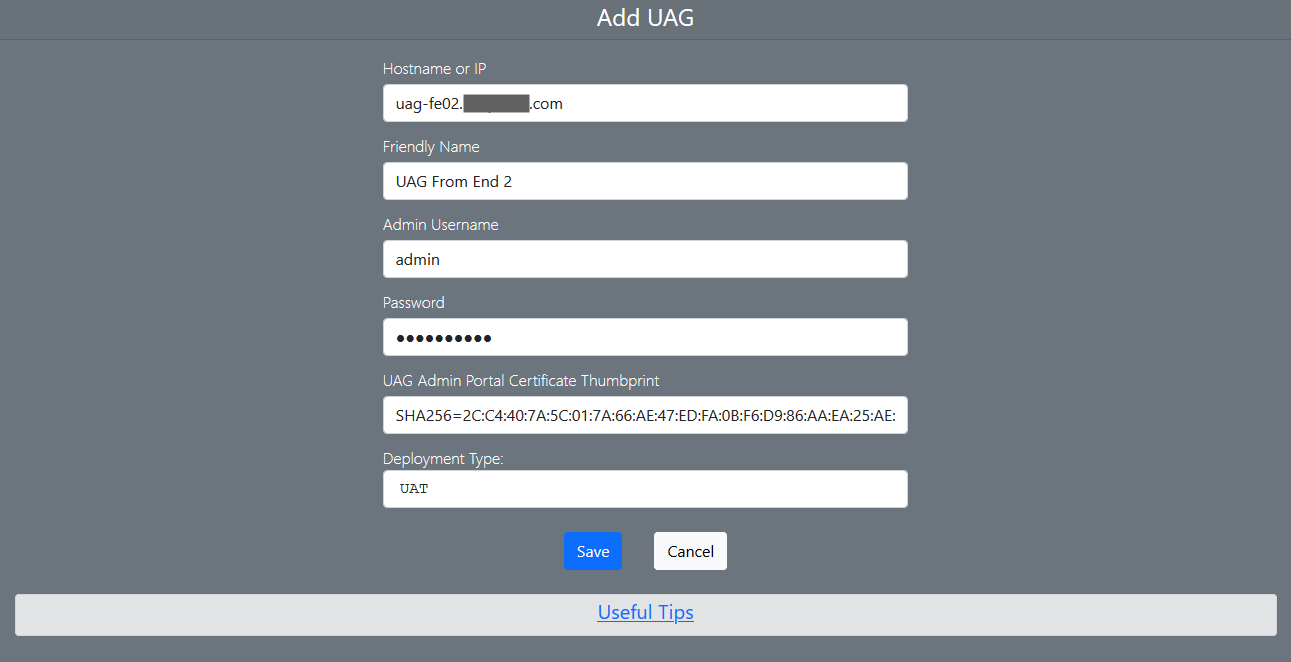
ESO Admin Portal - Manage UAGs Page - The following information is required when adding a UAG:
- Hostname or IP
- Friendly Name (This name will be used in the dashboard as the legend for the UAG in the widget/chart)
- Admin Username (UAG Admin username)
- Password (UAG Admin password)
- Certificate Thumbprint of UAG Admin Portal (served at port 9443 of UAG)
- Deployment Type (Prod / UAT / Dev)
ESO Admin Portal - Add UAG Page
- Click ‘Save’
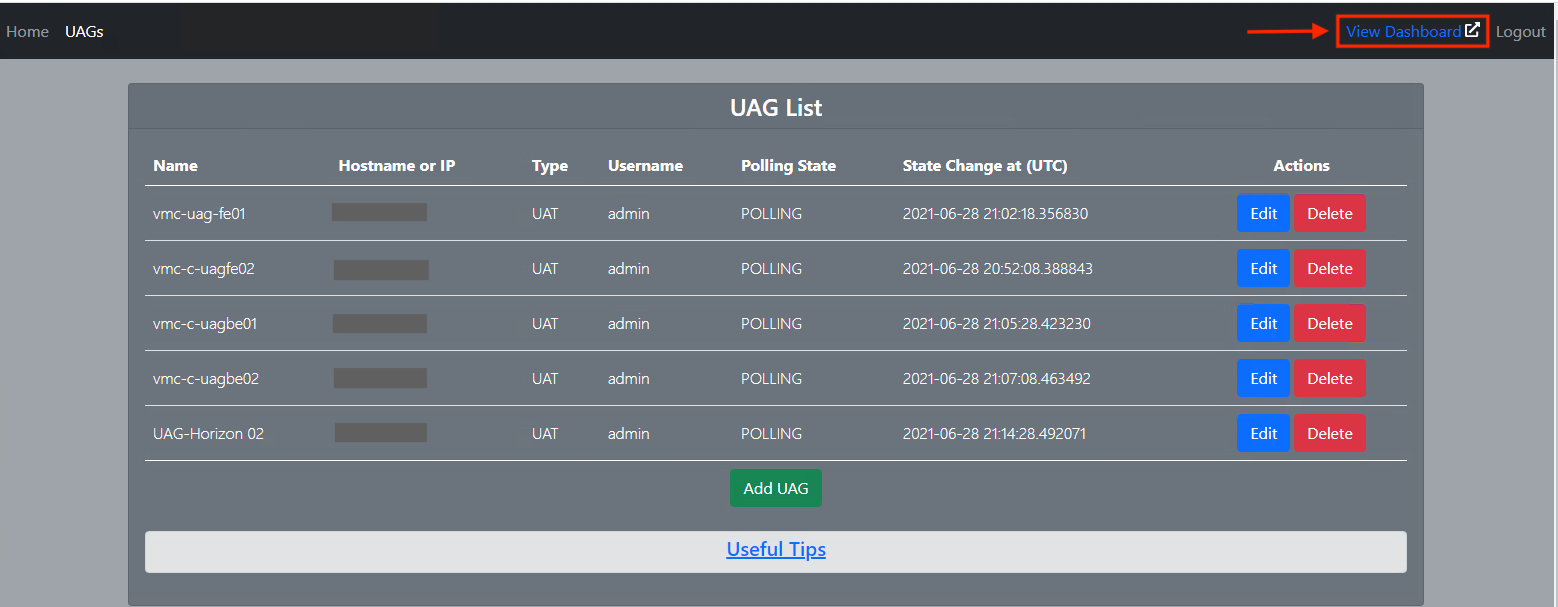
- Once saved, click on “View Dashboards” link on the top right of the “UAGs” page to access the Dashboards
ESO Admin Portal - Manage UAGS Page - Login with the password configured during the deployment of the appliance (Username is “admin”)
ESO Dashboards - Login Page - You are now viewing a sample dashboard for VMware Tunnel metrics
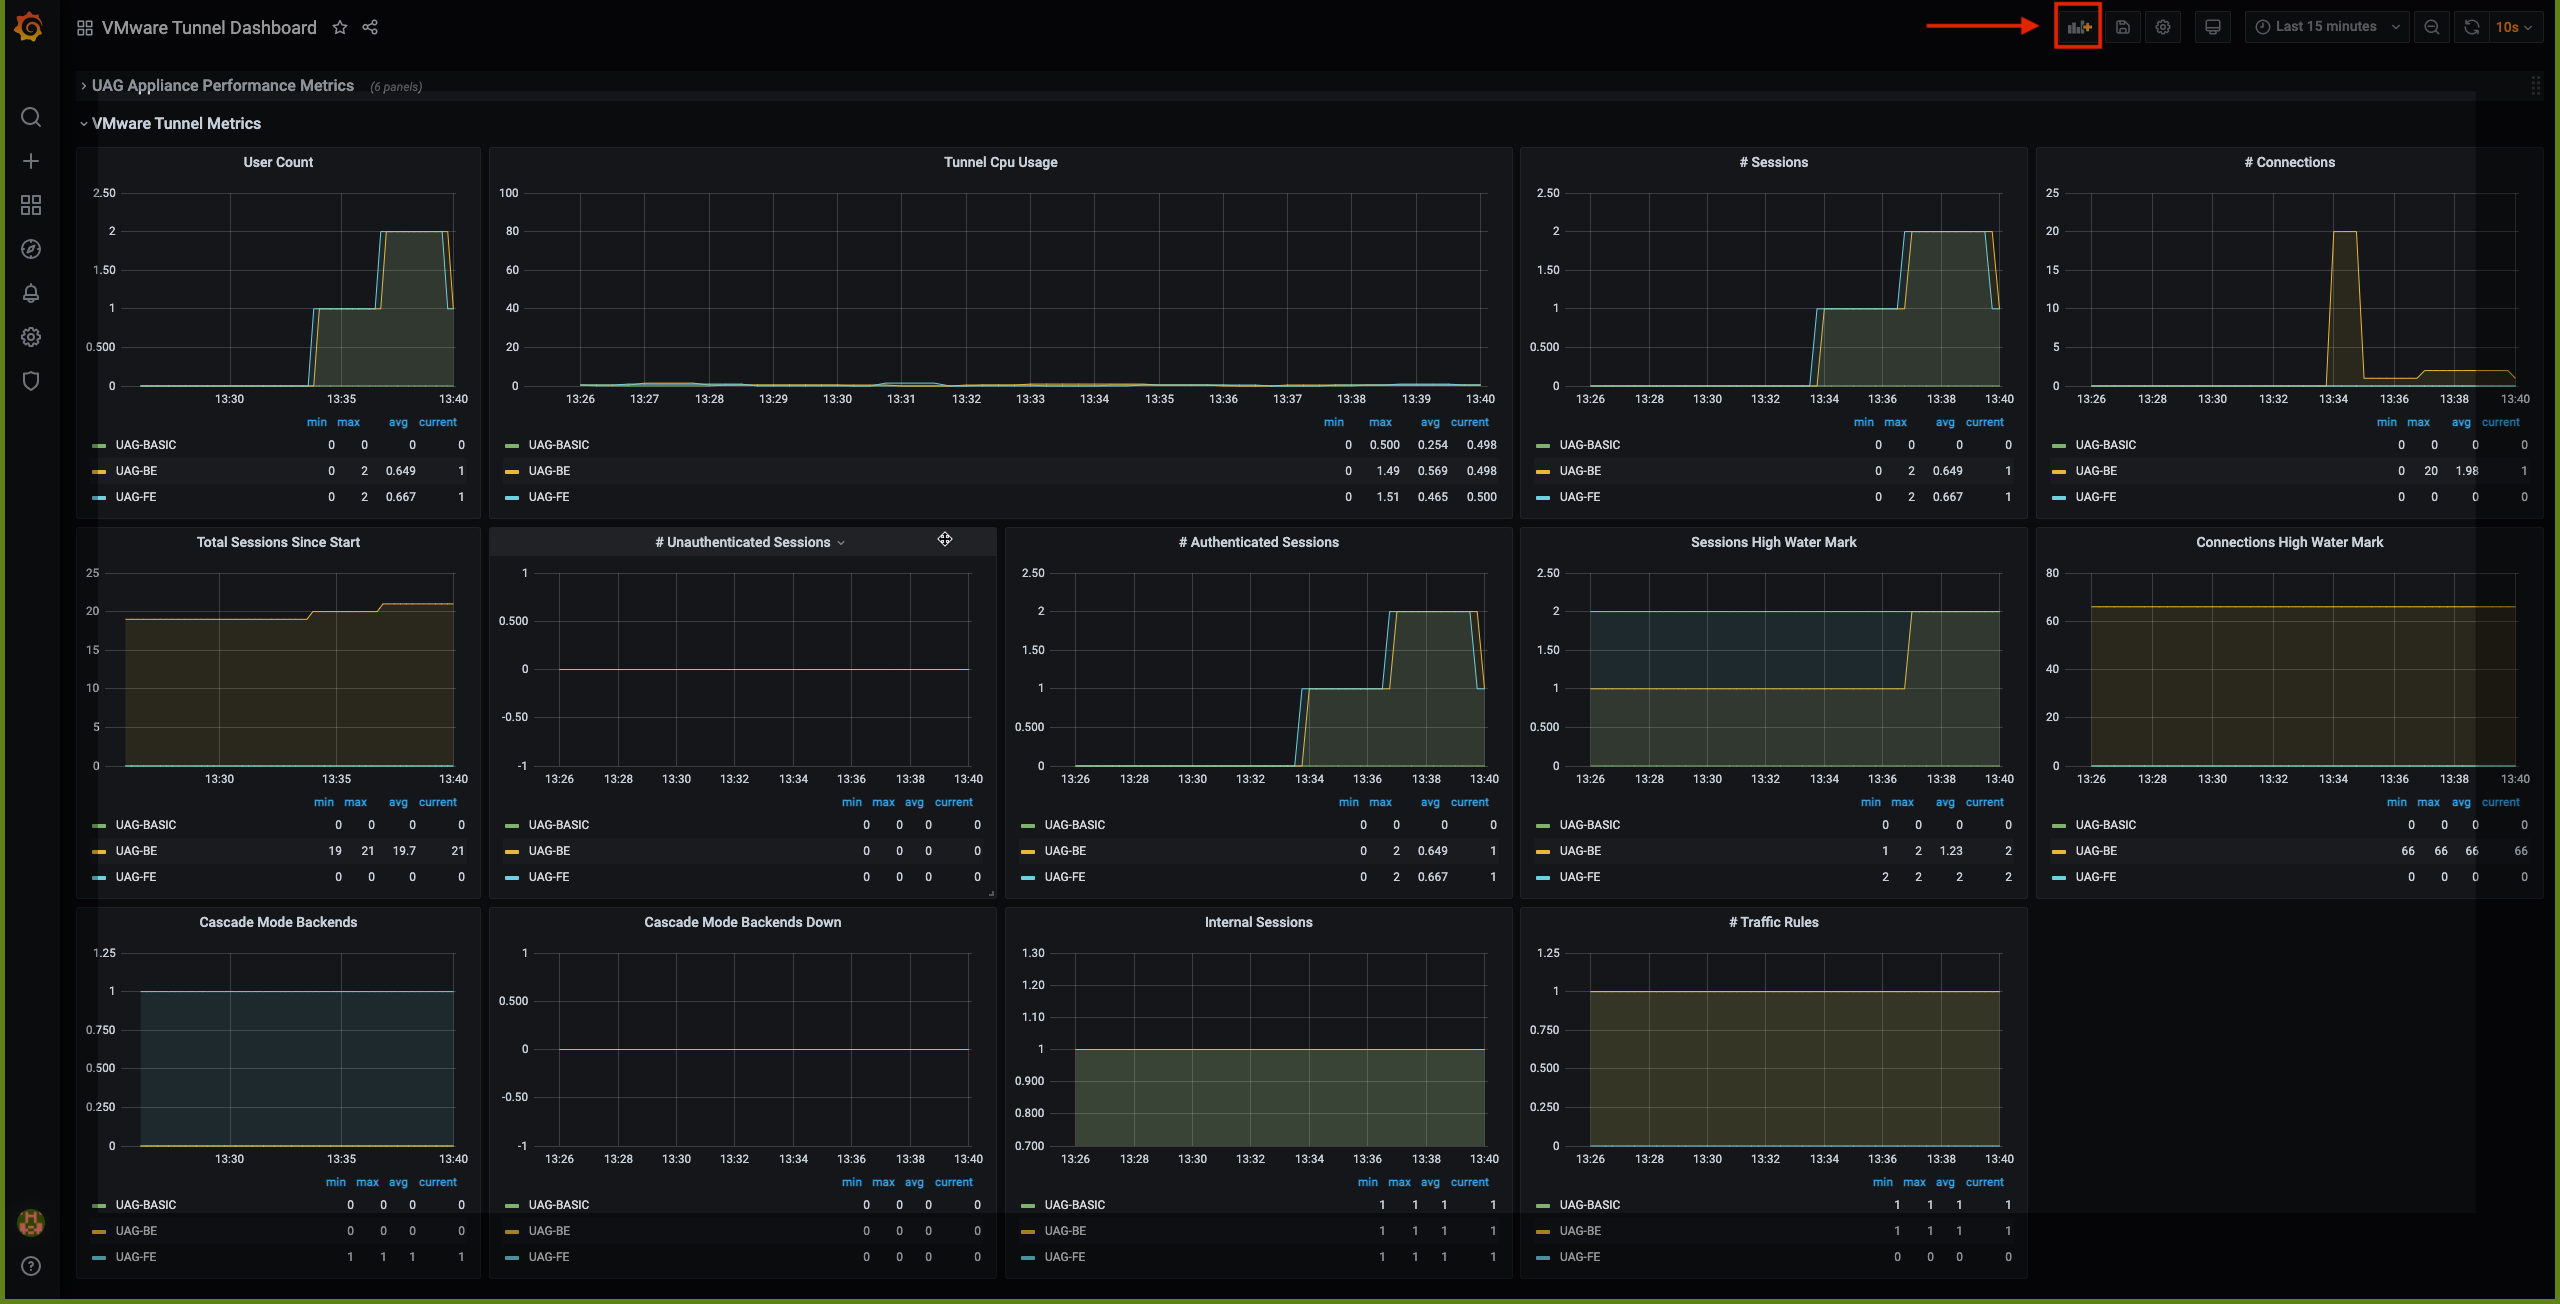
VMware Tunnel Dashboard


Dashboard is a collection of widgets
• Every widget is called a Panel
• A group of panels is called a Row
- The VMware Tunnel Dashboard is split into two rows
- UAG Appliance Performance Metrics
- UAG Appliance CPU, Memory performance metrics
- VMware Tunnel Metrics
- VMware Tunnel Session and Connection Metrics
- UAG Appliance Performance Metrics
- There is also a sample dashboard available for VMware Horizon metrics
- To access the VMware Horizon sample dashboard, navigate to Dashboards menu on the left pane, and select “Manage”
- Now select “Horizon Dashboard”
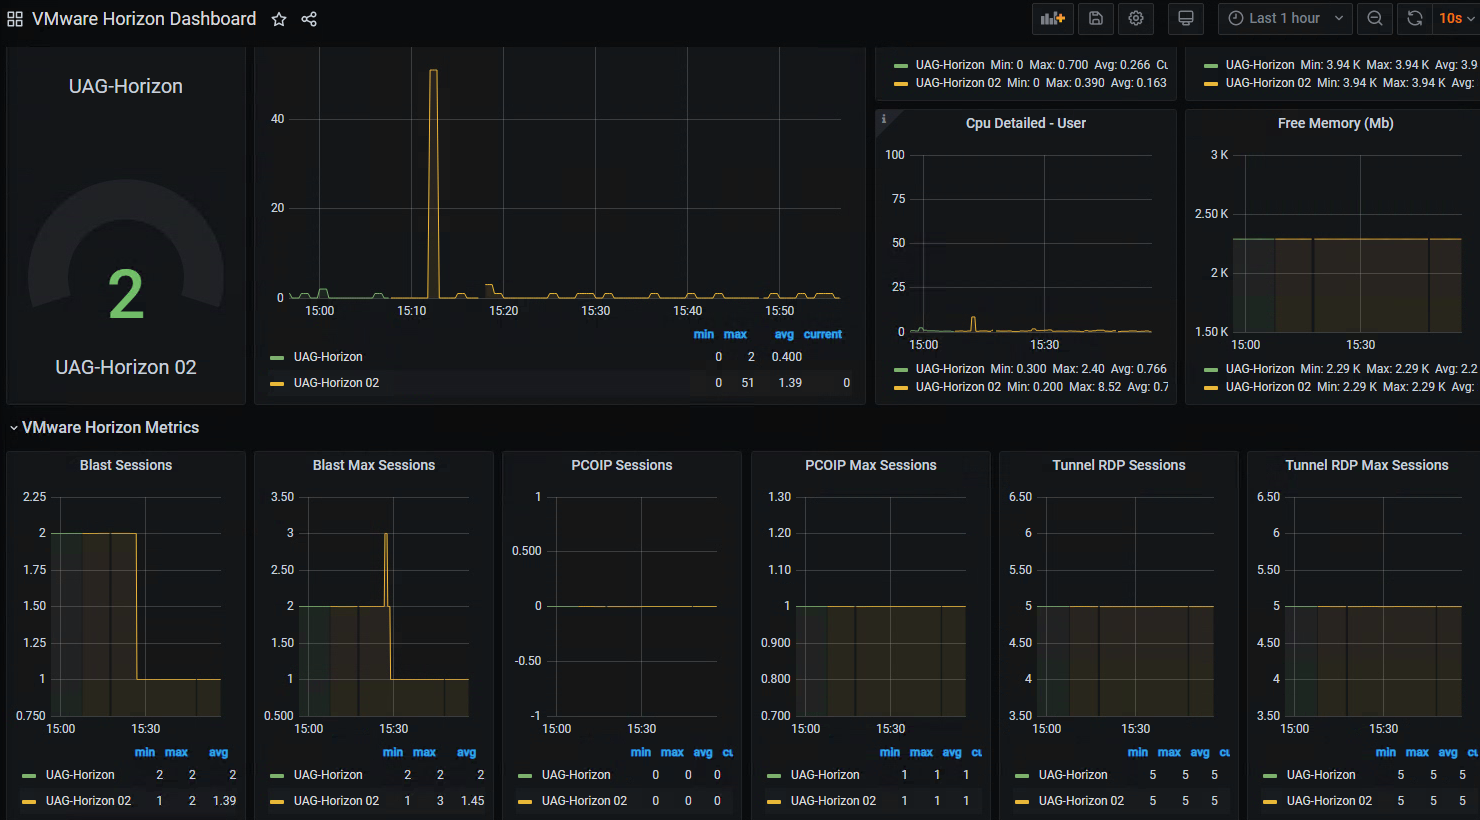
VMware Horizon Dashboard - The Horizon Dashboard is split into two rows
- UAG Appliance Performance Metrics
- UAG Appliance CPU, Memory performance metrics
- Horizon Protocol Sessions Metrics
- Horizon Protocol Sessions (PCOIP, Blast, RDP) Metrics
- UAG Appliance Performance Metrics
Note: The sample dashboards provided contain panels (widgets) for visualizing curated metrics from VMware Tunnel and VMware Horizon Edge Services. However, as an administrator you have the option to configure any of the additionally available metrics as widgets for the existing dashboards, as well as build new dashboards for other Edge Services as needed. Please refer to the “Tips & Tricks” section for steps to configure additional metrics in Dashboard as a widget/panel.
Tips & Tricks
Admin Portal
1. Obtaining Certificate Thumbprint
How to obtain UAG Admin Portal’s (served on port 9443) certificate thumbprint?
-
Install openssl on your Operating System and run
-
macOS/Linux
openssl s_client -connect uag_hostname:9443 < /dev/null 2>/dev/null | openssl x509 -fingerprint -noout -in /dev/stdin -sha256 -
Windows
openssl s_client -connect uag_hostname:9443 | openssl x509 -fingerprint -noout -sha256 -
Thumbprint Format
-
A thumbprint is in the format alg=xx:xx, where alg can either be the SHA1, SHA256; xx:xx are hexadecimal digits
-
Eg: SHA256=2C:C4:40:7A:5C:01:7A:66:AE:47:ED:FA:0B:F6:D9:86:AA:EA:25:AE:BD:9F:E4:3F:AC:AC:91:2F:E8:56:14:6
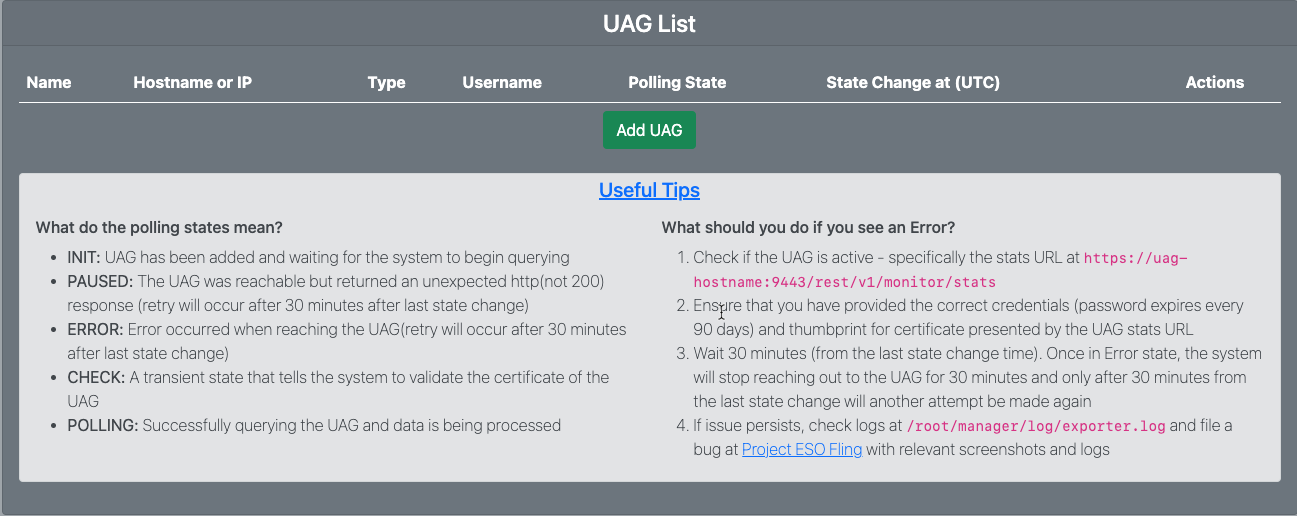
2. Polling States
What do the “Polling states” listed on the “Manage UAGS” page indicate?
- INIT: UAG has been added and waiting for the system to begin querying
- PAUSED: The UAG was reachable but returned an unexpected http(not 200) response (retry will occur after 30 minutes after last state change)
- ERROR: Error occurred when reaching the UAG (retry will occur after 30 minutes after last state change)
- CHECK: A transient state that tells the system to validate the certificate of the UAG
- POLLING: Successfully querying the UAG and data is being processed
3. Polling State - ERROR
What should you do when you see an “Error” under “Polling State”?

- Check if the UAG is active - specifically the stats URL at https://uag-hostname:9443/rest/v1/monitor/stats
- Ensure that you have provided the correct credentials (password expires every 90 days) and thumbprint for certificate presented by the UAG stats URL
- Wait 30 minutes (from the last state change time). Once in Error state, the system will stop reaching out to the UAG for 30 minutes and only after 30 minutes from the last state change will another attempt be made again
- If issue persists, check logs at /root/manager/log/exporter.log and file a bug at Project ESO Fling with relevant screenshots and logs
4. Reset ESO Admin Password
How do you reset password to login to ESO Admin Portal?
- SSH into the ESO Virtual Appliance
- Run the following command to reset password for ESO Admin Portal
curl -i -X PATCH -H "Content-Type: application/json" -d '{"username":"admin","password":"enter new password here"}' http://127.0.0.1:5000/api/users
Dashboards
1. Polling Frequency
How frequently is the ESO polling the UAGS for metrics?
- ESO polls the configured list of UAGS every 1 minute for metrics
2. Data Retention Period
What is the data retention period in ESO for the metrics polled from UAGs?
- Currently, metrics are stored for 30 days
3. Adding Metrics and Panels
How to configure additional metrics as widgets?
- From the Dashboards page, click on “Add Panel”
Dashboards - Add Panel - Navigate to the “Query” tab on the bottom of the page
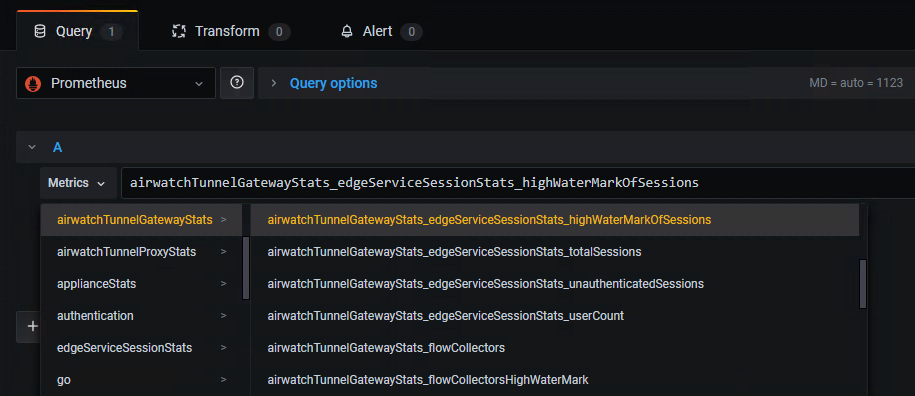
Dashboards - Add Panel - New Metrics Query - Click on the dropdown next to “Metrics”
- All available metrics polled (as applicable) are listed in the dropdown
- Select the desired metric from the list
- Provide a title to the Panel, adjust the Visualization settings on the right pane as required
- Click on ‘Apply’ on the top right section of the page
4. No Data in Panel
What should you do when you see “No Data” in a panel (widget) on one of the sample dashboards?
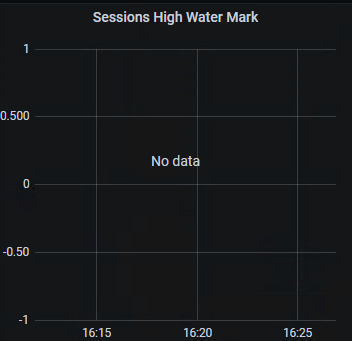
- The sample dashboards are built based on metrics query polled from UAG version 20.12. It is possible that the configured metric is available under a different name in the UAG version used in your environment
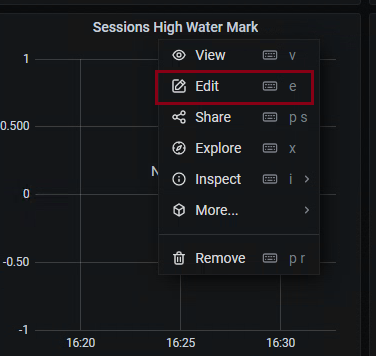
- In such a case, the administrator has the option to edit the panel to reconfigure the query to use the updated metric (as applicable)
- To edit the panel, right-click the panel title and select “Edit”
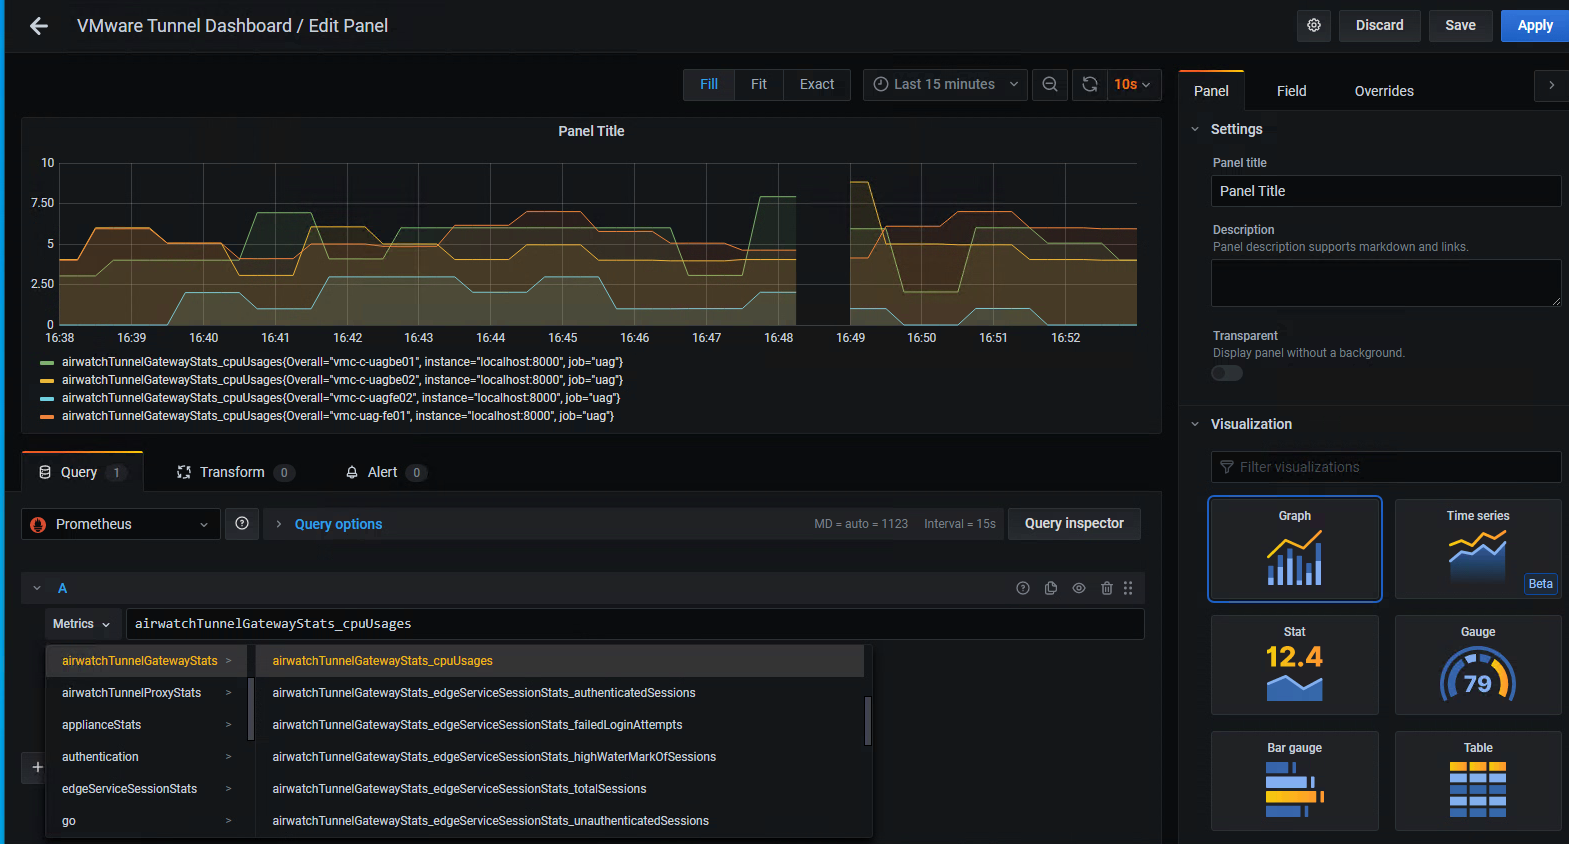
Dashboards - Edit Panel - Navigate to the “Query” tab on the bottom of the page
- The “Metrics” dropdown lists all the metrics available from the configured UAGs to be used in the Dashboard
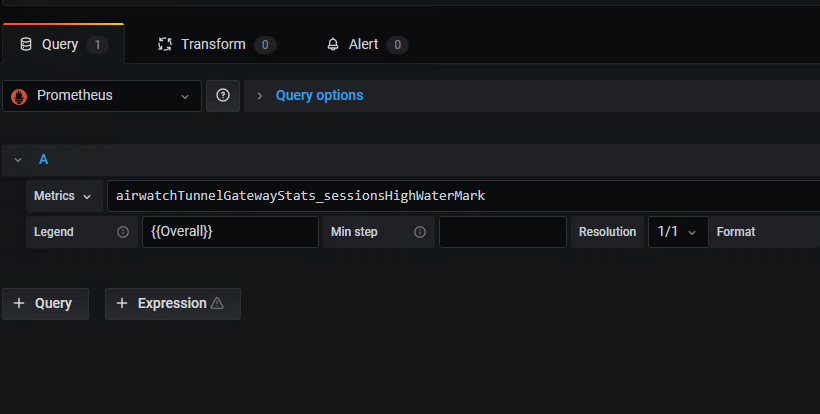
Dashboards - Edit Panel - Metrics Query - Update the query by selecting the required metric from the “Metrics” dropdown
Dashboards - Edit Panel - Update Query - Click on ‘Apply’ on the top right section of the page
5. Monitoring ESO
How to monitor the performance of ESO Appliance itself?
- From the Dashboards menu, select “Manage”
- Select the “ESO Appliance Stats” dashboard
ESO Appliance Stats - This dashboard contains widgets for monitoring performance metrics (CPU, Disk, Memory, System, Network) from the ESO Appliance
ESO Appliance Stats


What Next?
We are evaluating
- alerting and integration options with various tools including serverless functions to orchestrate workflow actions based on ESO telemetry
- adding more metrics to be available in the dashboards (only numerical values are supported today)
There is certainly a lot more to come on that front, so stay tuned …
Credits
I’d like to thank P.K for the opportunity to collaborate on this Fling and for being an amazing mentor throughout this process.